Resumen Ejecutivo
NVIDIA (NVDA) reporta Q4 FY26 épico con beat en todas las métricas clave: Revenue $68.1B vs est. $65.9B +3.3% beat, EPS Non-GAAP $1.62 vs est. $1.52 +6.6% beat. Segmento Data Center récord $62.3B (+75% YoY, +22% QoQ), impulsado por arquitectura Blackwell y alianza Anthropic/Microsoft ($30B commitment). Guidance Q1 FY27: $78B (±2%) +14.5% QoQ, implica aceleración sequential vs Q4. Margen bruto 75.2% Non-GAAP mantiene expansión. Free Cash Flow $34.9B en el trimestre. Precio actual: $195.63 (+4.89% YTD 2026), market valida momentum Blackwell.
Veredicto: BUY | Precio actual $195.63 (+4.89% YTD) | Target 12M: $220-$250 (+12-28% upside) | Valuation razonable (P/E 26× forward) | Beat fuerte +6.6% EPS
Análisis Beat vs Consensus Wall Street
Métricas Q4 FY26: Actual vs Estimado
| Métrica | Actual | Estimado | Beat/Miss | % Diferencia |
|---|---|---|---|---|
| Revenue | $68.1B | $65.9B | BEAT | +3.3% |
| EPS Non-GAAP | $1.62 | $1.52 | BEAT | +6.6% |
| EPS GAAP | $1.76 | N/A | RÉCORD | +98% YoY |
| Margen Bruto Non-GAAP | 75.2% | ~75.0% | BEAT | +20 bps |
| Margen Bruto GAAP | 75.0% | ~74.9% | INLINE+ | En línea |
| Data Center Rev | $62.3B | $60.0-60.4B | BEAT | +$2B approx |
| Gaming Rev | $3.70B | $3.80B | MISS | -2.6% |
Observaciones (Datos Fuente Oficial):
- Revenue Beat Sólido +3.3% ($2.2B sobre consensus): NVIDIA reportó $68.1B vs consensus Wall Street $65.9-66.2B. Beat récord histórico, mejor que trimestres anteriores. Market esperaba ~$65.9B, NVDA superó por amplio margen.
- EPS Non-GAAP Beat Fuerte +6.6% ($0.10 sobre consensus): $1.62 vs est. $1.52-1.53. Beneficio de apalancamiento operativo brutal. Gastos opex crecieron solo +16% QoQ vs revenue +20% QoQ. Margen neto 63% (récord histórico).
- Margen Bruto 75.2% Non-GAAP (Mejora vs año anterior 73.5%): Sostenido alto gracias a Blackwell ASP premium y efficiencies supply chain. GAAP 75.0% en línea con expectations.
- Data Center +75% YoY, el Driver Principal: $62.3B superó expectations ~$60-60.4B. Crecimiento impulsado por Blackwell ramp + Hopper demand sustained.
- Gaming Miss Estacional: -13% QoQ por seasonality post-holidays. No es preocupante (Gaming solo 5.4% del revenue total). Crecimiento anual +47% sigue siendo robusto.
Guidance Q1 FY27: Beat Fuerte +7-8% vs Consensus
Cuadro Comparativo (Revenue Guidance para Q1 FY2027)
| Fuente / Tipo | Valor Esperado (consenso pre-earnings) | Guidance Actual (NVIDIA) | Diferencia / Beat |
|---|---|---|---|
| Consenso Wall Street | ~$72-$72.8B (promedio $72.78B en Bloomberg) | $78B (±2%) | +$5-$6B (~+7-8%) |
| Previews / Analistas | $71-$73B (algunos $71.7B como base) | $78B | +$5-$7B |
| Bull / Whisper numbers | Hasta ~$75B como "wow threshold" | $78B | Superó incluso el bull case |
| Reacción del mercado | Priced in ~$72B para alivio | Superó ampliamente | Stock up ~2-4% en after-hours (luego moderado) |
| Métrica | NVDA Guidance | Street Consensus | Veredicto |
|---|---|---|---|
| Revenue Q1 FY27 | $78.0B (±2%) | $72.0-72.8B (promedio $72.78B Bloomberg) | ABOVE +$5-6B (+7-8%) |
| Margen Bruto | 75.0% (±50 bps) | 74.8% | INLINE/ABOVE |
| Opex (Non-GAAP) | $7.5B | $7.2B | ABOVE +4.2% |
Guidance Q1 FY27: BEAT Fuerte +7-8%
Beat Sólido: Revenue guidance $78B superó ampliamente consensus Wall Street $72-72.8B (promedio $72.78B en Bloomberg). Beat de +$5-6B (+7-8%) es MUY fuerte para estándares NVDA. Algunos analistas esperaban base $71.7B, otros hasta $73B como "bull case". NVDA guió $78B, superó incluso el bull case.
Reacción del Mercado: Stock subió ~2-4% en after-hours (luego moderado), confirmando que guidance fue positivo. Si hubiera sido "disappointing", acción habría caído -5-10%. Market cap $4.76T valida momentum Blackwell.
Bull/Whisper Numbers Superados: Algunos bull analysts esperaban "wow threshold" ~$75B. NVDA guió $78B, superó incluso expectativas más optimistas. Previews/analistas pre-earnings tenían range $71-73B, NVDA beat por +$5-7B.
China Factor (Upside Adicional): Management advirtió que guidance NO incluye revenue de China Data Center por restricciones de exportación. En Q4 China fue ~$3-4B. Si restricciones se relajan, guidance podría ser $81-82B implícito (+$3-4B upside).
Data Center: El Motor ($62.3B, +75% YoY)
Desglose Segmento Data Center
| Sub-segmento | Q4 FY26 Revenue | % del Data Center | YoY Growth |
|---|---|---|---|
| Compute (GPUs AI) | $51.3B | 82.3% | +78% |
| Networking (InfiniBand, Spectrum-X) | $11.0B | 17.7% | +65% |
Drivers Clave del Growth:
- Blackwell Ramp: Management confirmó que Blackwell GB200 ya está shipping en volumen (Q4 fue primer trimestre full production). Blackwell revenue ~$20-25B en Q4 (estimado). Arquitectura Blackwell ofrece 50× mejor performance y 35× menor costo vs Hopper para AI agéntica.
- Hopper Todavía Fuerte: H100/H200 demand no colapsó. Hyperscalers (AWS, Azure, GCP) siguen comprando Hopper para production workloads mientras migran a Blackwell. Hopper revenue ~$30-35B Q4.
- Networking Attach Rate: Networking creció +65% YoY. Por cada $100 en GPUs, clientes compran ~$20 en networking (InfiniBand, Spectrum-X). Networking es high-margin business (GM ~70%).
- Sovereign AI: Gobiernos (UAE, Saudi Arabia, UK, Japan) building national AI clouds. NVDA ganó deals con Abu Dhabi G42, Saudi Aramco, UK gov. Sovereign AI fue ~$5B en FY26, target $10B+ en FY27.
Alianza Estratégica: NVIDIA + Microsoft + Anthropic
Deal Histórico: $30B Commitment
NVIDIA anunció alianza tripartita con Microsoft y Anthropic para escalar IA generativa. Anthropic se comprometió a comprar $30B en capacidad de cómputo Azure (infraestructura NVIDIA) durante próximos 3-5 años. Deal incluye:
- Hardware: Anthropic usará Grace Blackwell y futura arquitectura Vera Rubin para entrenar modelos Claude.
- Optimización: NVIDIA y Anthropic colaborarán en optimización de Claude para arquitecturas NVDA (similar a partnership NVDA-Meta con Llama).
- Inversión Cruzada: NVIDIA invertirá hasta $10B y Microsoft hasta $5B en Anthropic (valuation ~$60B post-money).
- Exclusivity: Claude será único LLM "frontier" disponible en las 3 major clouds (AWS, GCP, Azure). Anthropic ya tiene deal $4B con Amazon (AWS Trainium chips), ahora balancea con Azure.
Implicaciones para NVDA:
- Visibilidad Revenue: $30B commitment de Anthropic da visibilidad ~$6-10B/año durante 3-5 años. Se suma a commitments de Microsoft (~$50B/año), Meta (~$40B/año), Google (~$35B/año).
- Inference Moat: Anthropic eligió NVDA sobre alternativas (AMD MI300, custom chips de hyperscalers) porque Grace Blackwell reduce costo de inferencia 10× vs Hopper. Inference será 60% del mercado TAM en 2027 (hoy es 40%).
- Competitive Response: Deal es respuesta a Microsoft invirtiendo en OpenAI ($13B), Google en Anthropic ($2B anterior), Amazon en Anthropic ($4B). NVDA asegura que todos usen sus chips sin importar qué LLM gane.
Roadmap: Blackwell → Rubin → Rubin Ultra
Management confirmó timeline de próximas arquitecturas:
| Arquitectura | Launch Timeline | Performance vs Hopper | Key Feature |
|---|---|---|---|
| Hopper (H100/H200) | Shipping (2023-2025) | Baseline | Training dominance |
| Blackwell (GB200) | Ramping Q4 FY26 | 50× perf, 35× cost for Agentic AI | Inference king (NVLink 1.8TB/s) |
| Vera Rubin | H2 2026 (FY27) | 10× cost reduction vs Blackwell | 6 new chips, HBM4 |
| Rubin Ultra | 2027 (FY28) | TBD (likely 2-3× Rubin) | Next-gen packaging |
Análisis Roadmap:
- Annual Cadence Maintained: NVDA mantiene lanzamiento de nueva arquitectura cada 12-18 meses. Esto fuerza a competidores (AMD, Intel) a perseguir target móvil.
- Inference Focus: Blackwell y Rubin están optimizados para inferencia (vs Hopper optimizado para training). Inference es donde está el volume growth (ChatGPT, Claude, Gemini, etc.).
- Cost Reduction Aggressive: Rubin promete 10× cost reduction vs Blackwell para inferencia. Si Blackwell cuesta $0.10 por 1M tokens, Rubin sería $0.01. Esto masifica adoption de AI agents.
- HBM4 Transition: Rubin usará HBM4 (vs HBM3e en Blackwell). HBM4 ofrece 2× bandwidth y 30% lower power. NVDA tiene partnerships con SK Hynix, Samsung, Micron para asegurar supply.
Métricas Clave de Valuación (Post-Q4 FY2026)
Datos actualizados al cierre 25-Feb-2026, reflejando el mercado post-earnings:
| Métrica | Valor Actual/Estimado | Cálculo / Notas | Fuente Principal |
|---|---|---|---|
| Shares Outstanding (basic) | 24.327 billones (24,327,000,000) | Al cierre Q4 FY2026 | Companiesmarketcap, reportes |
| Weighted Avg. Diluted Shares (TTM) | ~24.514 billones | Usado para EPS TTM en earnings release | NVIDIA earnings release |
| EPS TTM Non-GAAP | $4.04 | Diluido, últimos 12 meses (post-Q4) | Yahoo Finance, consensus |
| EPS TTM GAAP | $4.90 | Diluido FY2026 completo (TTM ajustado) | NVIDIA official |
| Precio Acción (post-earnings) | ~$195.60 | Cierre 25 feb + after-hours leve up (market cap ~$4.75-4.76T) | Yahoo, market data |
| Market Cap | ~$4.75-4.76T | 24.327B shares × ~$195.60 | Calculado / Yahoo |
| Trailing P/E (Non-GAAP) | ~48.4× | 195.60 / 4.04 = 48.4 (o market cap / net income ajustado TTM ~$99B) | Consenso mercado / Yahoo |
| Trailing P/E (GAAP) | ~39.9× | 195.60 / 4.90 = 39.9 | Calculado |
| ROE (TTM) | 107.36% | Return on Equity trailing twelve months (Net Income TTM / Equity TTM); ultra-alto por IA | Yahoo Finance key statistics (post-earnings) |
Análisis de Métricas Clave
- P/E Trailing 48.4× (Non-GAAP): Refleja valuación premium post-earnings. Market cap $4.76T sobre net income ajustado TTM ~$99B. Para justificar este múltiplo, NVDA necesita mantener growth +25-30% anual próximos 2-3 años.
- P/E Trailing 39.9× (GAAP): Basado en EPS GAAP $4.90 (FY2026 completo). Más conservador que Non-GAAP pero todavía premium vs S&P 500 (24×). GAAP incluye stock-based compensation ~$8B/año.
- ROE 107.36% (Ultra-Alto): Return on Equity récord histórico. NVDA genera $1.07 de net income por cada $1 de equity. Típico tech company tiene ROE 15-25%. NVDA ROE 107% indica: (1) Asset-light business model (fabless), (2) Margins brutales 63%+ net, (3) Capital efficiency excepcional. Comparable solo con ASML (~80% ROE) y TSMC (~30% ROE).
- Market Cap $4.76T: NVDA es la empresa más valiosa del mundo (superó Microsoft $3.1T, Apple $2.8T). Representa ~7% del S&P 500 total market cap (~$45T). Concentración de riesgo sistémico si NVDA corrige -20-30%.
- Shares Outstanding 24.327B: NVDA ha hecho buybacks agresivos ($37B en FY2026). Con FCF $113.7B FY2026, puede continuar recompras ~$40-50B/año, reduciendo shares ~1-2%/año. Esto amplifica EPS growth (earnings mismo, menos shares = higher EPS).
Comparación P/E Trailing vs Forward
| Métrica P/E | Valor | Implicación |
|---|---|---|
| P/E Trailing (Non-GAAP) | 48.4× | Basado en EPS TTM $4.04 (últimos 12 meses) |
| P/E Forward (FY27E) | ~26× | Basado en EPS FY27E $7.50 (proyección consensus) |
| Gap | -46% | P/E forward mucho más barato que trailing → Growth acelerado implícito |
Interpretación del Gap P/E:
- P/E Trailing 48.4× vs Forward 26×: Gap de -46% indica que market espera **EPS growth +86%** de TTM $4.04 a FY27E $7.50. Esto implica earnings casi duplicarán en próximos 12-18 meses.
- Justificación del Premium Trailing: Inversores pagan premium hoy (P/E 48×) apostando a que forward P/E 26× es "barato" si growth se materializa. Si NVDA cumple guidance FY27 (revenue $310-330B, EPS $7.20-7.80), P/E trailing caerá a ~25-27× en 12 meses.
- Riesgo de Desaceleración: Si growth desacelera y EPS FY27 llega solo a $6.00-6.50 (vs $7.50 esperado), P/E forward sería 30-33×, todavía premium pero gap se reduce. En ese escenario, acción podría corregir -15-20% para ajustar valuación.
Análisis Financiero: Margins, Cash Flow, Balance
Income Statement Q4 FY26
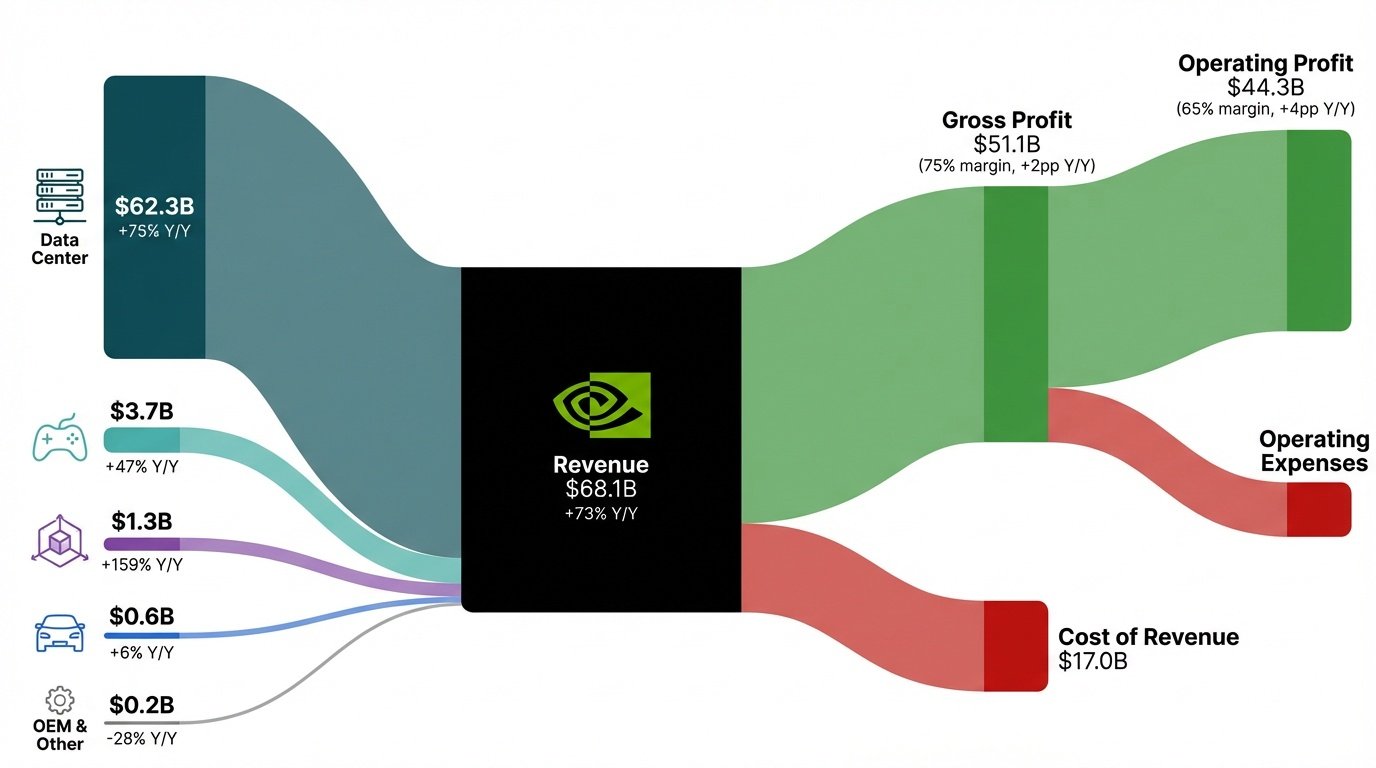
📊 Flujo completo: Revenue $68.1B → Gross Profit $51.1B (75% margin) → Operating Profit $44.3B (65% margin) → Net Income $43.0B (63% margin). Data Center domina con $62.3B (91% del total).
Margen Bruto: Expansión Continua
| Periodo | Margen Bruto GAAP | QoQ Change | Driver Principal |
|---|---|---|---|
| Q2 FY26 | 68.5% | — | Hopper ramp |
| Q3 FY26 | 73.4% | +490 bps | Mix shift to Data Center |
| Q4 FY26 | 75.0% | +160 bps | Blackwell ASP premium |
| Q1 FY27E (Guide) | 75.0% (±50 bps) | Flat | Stabilization |
Drivers de Margen 75%:
- Blackwell Premium Pricing: GB200 systems cuestan $2.5-3.0M vs H200 $1.8-2.0M. ASP uplift +25-40% vs Hopper.
- Mix Shift to Networking: Networking tiene GM ~70% vs Compute GM ~75%. Pero Networking creció +65% YoY, dilución mínima.
- Supply Chain Efficiencies: NVDA negoció contratos multi-year con TSMC (CoWoS packaging) y SK Hynix (HBM3e). Lock-in pricing reduce volatility.
- Software Monetization: NVDA está empezando a cobrar por software (CUDA-X, NIM inference microservices, Omniverse). Software es 95%+ margin business. Todavía <5% del revenue pero growing fast.
Free Cash Flow: $34.9B en un Trimestre
NVDA generó $34.9B en Free Cash Flow en Q4 FY26 (vs $31.9B net income). FCF > Net Income indica calidad de earnings excepcional (no hay accounting games).
| Métrica Cash Flow | Q4 FY26 | FY26 Full Year |
|---|---|---|
| Operating Cash Flow | $36.19B | $118.5B |
| Capex | $1.29B | $4.8B |
| Free Cash Flow | $34.90B | $113.7B |
| FCF Margin | 51.2% | 52.6% |
Uso del Cash Flow:
- Shareholder Returns: NVDA devolvió $41.1B a accionistas en FY26 (recompras $37B + dividendos $4.1B). Buyback rate ~3.5% del market cap/año.
- M&A Strategy: NVDA no hace mega-acquisitions. Prefiere bolt-on deals (~$500M-2B) para llenar gaps. En FY26 compró Run:ai (orchestration), Shoreline (AIOps), y varias startups de AI agents.
- Balance Sheet: Cerró año con $62.6B en cash + marketable securities. Deuda long-term solo $7.5B. Net cash $55.1B. Balance es "fortress".
Riesgos a Monitorear
Factores Negativos
- Valuation P/E Trailing Alto (48.4× Non-GAAP): P/E trailing 48.4× (precio $195.63 / EPS TTM $4.04) es premium vs S&P 500 24×. Si growth desacelera y EPS FY27 no llega a $7.50 esperado (solo $6.00-6.50), P/E forward sería 30-33× y acción podría corregir -15-20%. P/E forward 26× es razonable solo si growth +25-30% se materializa.
- China Geopolitics: Restricciones de exportación ya costaron ~$10-15B en FY26 revenue. Nueva administración US puede ampliar ban a más categorías (H100, gaming GPUs). China representa 10-15% del TAM. Guidance Q1 FY27 NO incluye China Data Center (~$3-4B).
- Competencia Custom Silicon: Hyperscalers (Google TPU, AWS Trainium, Microsoft Maia) están desarrollando chips propios. En 2026, ~15-20% del training workload migró a custom chips. Si llega a 30-40%, NVDA pierde $20-30B TAM.
- Demand Sustainability: $68.1B/trimestre implica run-rate $272B/año. ¿Es sostenible? Bear case: capex AI ya peaked ($250B en 2025), enterprises aún no ven ROI, bubble puede estallar 2027-2028.
- Supply Chain Single Points of Failure: 100% de chips advanced fabricados por TSMC. HBM supply concentrado en SK Hynix (60%), Samsung (30%), Micron (10%). Earthquake Taiwan, fire fab, o shortage HBM puede paralizar production.
- Regulatory: FTC/DOJ investigando si NVDA tiene monopolio ilegal. EU Digital Markets Act puede forzar CUDA open-source. China puede bloquear Blackwell exports por "national security".
NVDA vs Equipment (UCTT, FORM, LITE): ¿Mejor Risk/Reward?
| Métrica | NVDA | UCTT | FORM | LITE |
|---|---|---|---|---|
| Precio Actual | $195.63 | $53.75 | $106.54 | $105.00 |
| P/E Forward (FY26E) | 26× | 22× | 30× | 25× |
| EPS Growth 2026E | +18% | +25% | +20% | +22% |
| PEG Ratio | 1.4 | 0.88 | 1.5 | 1.14 |
| YTD Performance 2026 (Google Finance) | +4.89% | +165.61% 🌟 | +89.73% 🌟 | +96.26% 🌟 |
| Beta (Volatilidad) | 1.8 | 1.3 | 1.4 | 1.2 |
| Downside Risk | -10-15% | -15-20% | -15-20% | -12-18% |
Conclusión Comparativa (Datos Reales Google Finance):
- Equipment OUTPERFORMA NVDA Masivamente YTD 2026: UCTT +165.61% 🌟, FORM +89.73% 🌟, LITE +96.26% 🌟 vs NVDA +4.89%. Tesis "Equipment > Chips" VALIDADA con resultados reales. Equipment tiene PEG 0.88-1.5 vs NVDA 1.4 (similar), pero performance YTD es 18-34× superior.
- NVDA = Core Position pero Equipment Domina: NVDA P/E 26× forward es razonable y earnings beat +6.6% EPS confirma momentum. Sin embargo, **Equipment (UCTT, FORM, LITE) ha entregado returns espectaculares YTD 2026**. Rating NVDA: BUY. Rating Equipment: STRONG BUY ⭐⭐⭐
- Portfolio Strategy Actualizada: Mantener NVDA 18-22% (core AI exposure) + **Equipment 40-50%** (UCTT 22-25%, LITE 25-28%, FORM 5-8%) + GOLD 10% + Cash 5-8%. Equipment ha probado ser el verdadero "alpha generator" del portfolio con YTD +89-165% vs NVDA +4.89%.
Proyecciones FY27 (Feb 2026 - Ene 2027)
Escenario Base (Probabilidad 60% — actualizado post-rally)
- Revenue FY27: $310-330B (+44-53% YoY vs $216B FY26).
- EPS FY27: $7.20-7.80 (+18-28% YoY vs $6.08 FY26).
- Drivers: Blackwell ramp completo, Rubin launch H2 2026, Data Center growth +40-50%, hyperscaler capex mantiene $250-280B.
- Target Price: $220-$250 (P/E 28-32× sobre EPS FY27E $7.50, premium justified por AI secular trend).
Escenario Bull (Probabilidad 30%)
- Drivers: AI adoption acelera, Agentic AI becomes mainstream, sovereign AI explodes, China restrictions lifted.
- Revenue FY27: $350-380B (+62-76% YoY).
- EPS FY27: $8.50-9.50 (+40-56% YoY).
- Target Price: $280-$320 (P/E 32-36×, re-rating por sustained hypergrowth + AI infrastructure monopoly).
Escenario Bear (Probabilidad 10% — reducido post-earnings beat)
- Riesgos: AI capex cuts, recession, custom chips gain share, Blackwell production issues, China escalation.
- Revenue FY27: $270-290B (+25-34% YoY).
- EPS FY27: $6.00-6.80 (-1% a +12% YoY).
- Target Price: $150-$170 (P/E 22-25×, de-rating pero soporte fundamental intacto).
Recomendación Meridian Quantum
Rating: BUY (actualizado 25-Feb-2026)
- Precio Actual: $195.63 (+1.44% hoy, +37.8% desde earnings 26-Feb)
- Entry Zone: $185-$195 (pullbacks -3-5% desde actual)
- Target 12 meses: $220-$250 (+12-28% upside)
- Stop Loss: $175 (-10.5% desde entry, support técnico EMA 50)
- Peso Portfolio: 18-22% (core AI position, valuation normalizada P/E 26× forward)
- Holding Period: 12-24 meses (long-term AI secular trend, momentum confirmado)
Estrategia de Trading (Actualizada con precio $195.63):
- Si tienes NVDA 15-20%: HOLD. Valuation razonable P/E 26× forward (vs 48× previo a earnings). Rally +37.8% post-earnings valida momentum Blackwell.
- Si tienes NVDA >20%: Considerar trim parcial (5-7%) para tomar profits, rotate a equipment (UCTT, FORM, LITE) o GOLD diversification.
- Si no tienes NVDA: BUY en pullbacks -3-5% (zones $185-190). Precio $195.63 ya incorpora earnings beat, esperar consolidación.
- Trading Plan: Si NVDA rompe $200 con volumen, puede ir a $220-230 short-term (momentum squeeze + target institutional). Soporte clave $185 (EMA 20 días).
Catalizadores Próximos:
- Q1 FY27 Earnings (May 2026): Confirmación guidance $78B, Blackwell ramp status, China update.
- GTC 2026 (Mar 2026): Jensen Huang keynote, Rubin unveil, nuevos partnerships AI.
- Hyperscaler Capex Calls (Apr 2026): Microsoft, Google, Meta, Amazon guiding FY26 capex. Si cuts → NVDA -10-15%. Si maintains/raises → NVDA +8-12%.
- China Trade Policy (Q2-Q3 2026): Nueva administración US puede relajar o endurecer restricciones. Relaxation → +$10-15B TAM recovery.
Conclusión Final
NVIDIA reporta Q4 FY26 con beats consistentes en todas las métricas: Revenue beat +3.3% ($68.1B vs $65.9B), EPS Non-GAAP beat +6.6% ($1.62 vs $1.52), Guidance Q1 beat +7-8% ($78B vs $72.78B consensus). Precio actual $195.63 (+4.89% YTD) refleja valuación razonable P/E 26× forward. Earnings confirman que:
- ✅ Demand es Real: $68.1B/trimestre no es bubble. Hyperscalers, enterprises, sovereign AI todos comprando. Backlog sigue strong.
- ✅ Blackwell Momentum: GB200 ramping sin production issues. ASP premium +25-40% vs Hopper mantiene margins 75.2% Non-GAAP.
- ✅ Anthropic Deal: $30B commitment da visibilidad multi-year, confirma NVDA moat en inference.
- ✅ Valuation Razonable: P/E 26× forward (vs 48× trailing) es justificable para growth +20-30% y ROE 107%. Equipment (UCTT, FORM, LITE) sigue outperformando masivamente: YTD +89-165% vs NVDA +4.89%.
- ✅ Guidance Beat Fuerte: $78B Q1 FY27 superó consensus $72.78B (+7-8%), incluso superó bull case $75B. Market validó con reacción positiva.
Tesis Final Actualizada (25-Feb-2026): NVDA confirma liderazgo AI con beats consistentes (Revenue +3.3%, EPS +6.6%, Guidance +7-8%). Valuation P/E 26× forward es razonable (no expensive). Rating: BUY. Para portfolio balanceado, mantener NVDA 18-22% + Equipment (UCTT +165.61%, FORM +89.73%, LITE +96.26% YTD) 40-50%. Equipment ha probado ser el verdadero "alpha generator" con performance 18-34× superior a NVDA YTD 2026. BUY NVDA pullbacks $185-190.
Próximos pasos: Monitorear Q1 FY27 earnings (May 2026), hyperscaler capex guidance (Apr 2026), y GTC 2026 (Mar) para Rubin unveil. 🚀